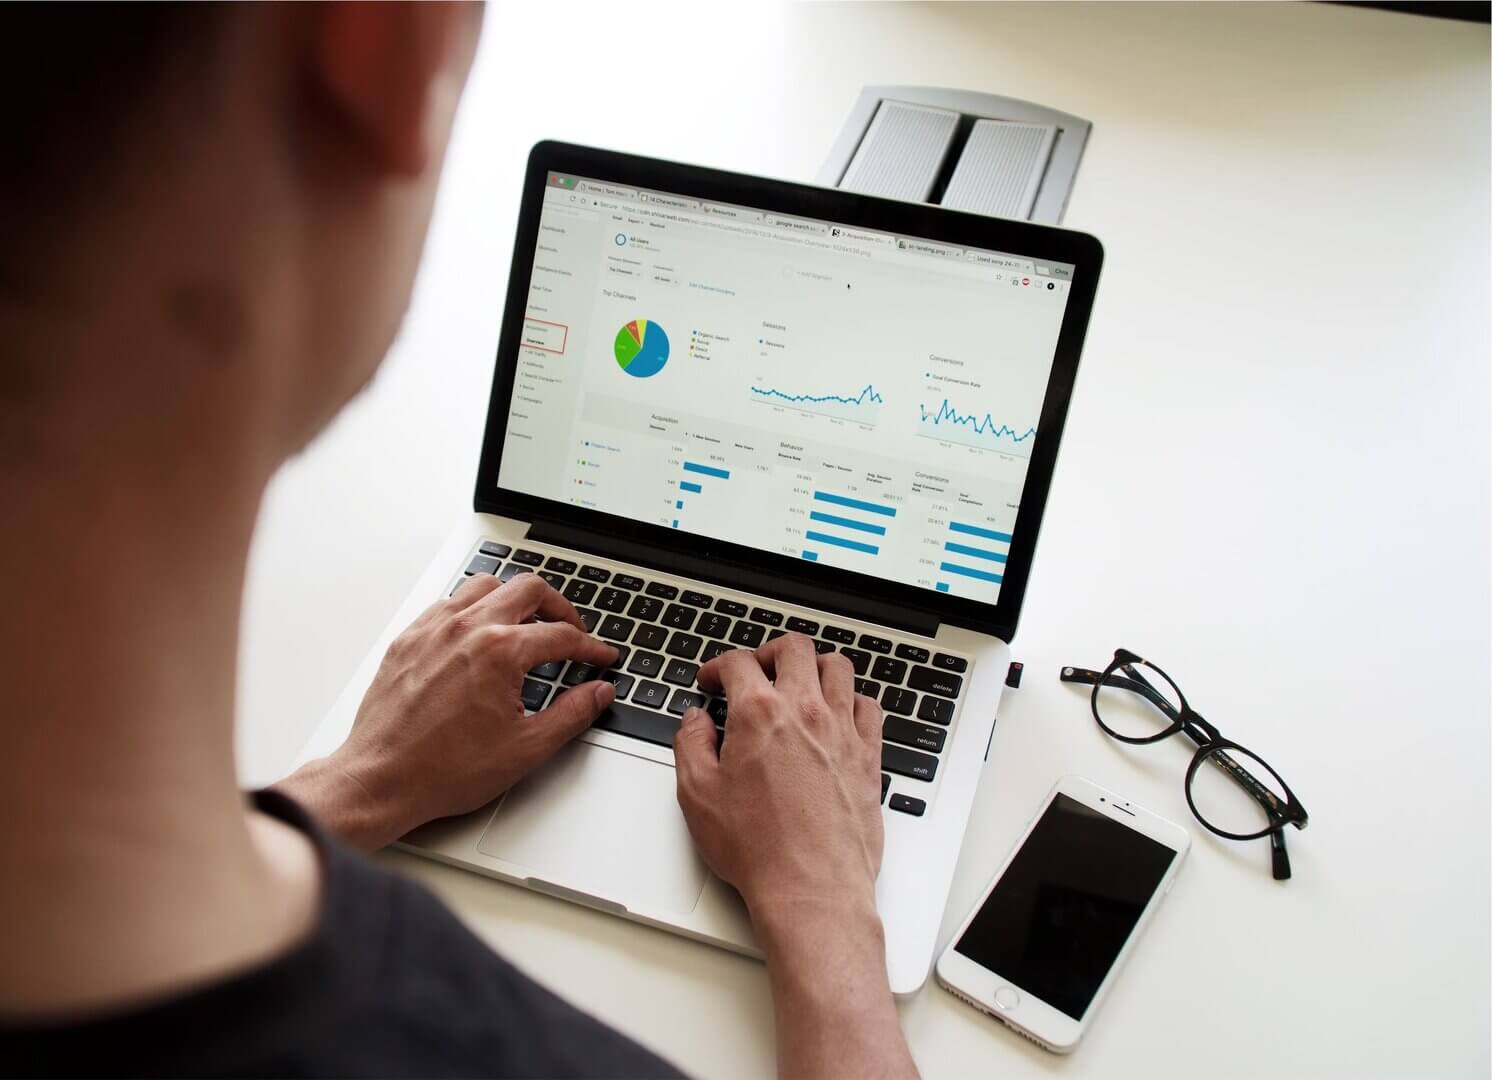
Data-Driven Dashboards
Solution example: BI dashboards with real-time KPIs via Prometheus and Grafana. Connected data sources as the basis for faster, better-founded decisions.
Solution example: how we implement a project like this. It does not describe a single client project.
Introduction: Data as the Basis for Decisions
Initial situation & goals
Data is a central basis for decisions. Interactive dashboards give decision-makers real-time access to the KPIs that matter. This solution example shows how we build data-driven analytics, for example for manufacturing companies.
The problem
Challenges
Delays
Typical starting point: slow reporting holds up important decisions.
Data silos
Data stored in separate systems makes it hard to see the full picture.
Poor visualization
Without charts and graphs, the numbers are hard to interpret.
Goals
Approach
Real-time analytics
Fast access to the relevant KPIs.
Connected data
All relevant data sources in one place.
Easy-to-use dashboards
Visualized data that supports better decisions.
A Technical Solution for Data-Driven Analytics
Approach
How we approach it: we build a solution that connects your data sources and visualizes them in real time.
Project management
Iterative development
Dashboards are adjusted regularly based on user feedback.
Technology choice
Proven tools such as Prometheus and Grafana.
Technologies & tools
Prometheus
Monitoring and storing metrics.
Grafana
Visualization and interactive dashboards.
ETL processes
Efficient extraction, transformation and loading of data.
APIs
Connecting different data sources.
Team & roles
Development team
Specialists in data integration and frontend visualization.
Data analysts
Define and refine the relevant KPIs.
Core Technical Functions
Implementation
A detailed overview of the functions that make data-driven analytics possible.
Core features
Prometheus and Grafana integration
Enables thorough monitoring and visualization.
APIs and ETL processes
Connect and transform data sources.
Interactive dashboards
Users can filter and customize the data.
Real-time alerts
Notify users of relevant changes or problems.
Summary: Transparency and Efficiency with Dashboards
Lessons learned
Lessons learned and where data-driven dashboards can go next.
Real-time data
Supports fast, well-founded decisions.
Better processes
Automation reduces workload and errors.
Next steps
Connect additional data sources
Add AI-based forecasts
Bottom line
What it delivers: data-driven dashboards keep key figures visible at all times, shorten the path from question to answer and make business processes transparent.
Related services
More case studies
Other projects

AI in Customer Service
How we put an AI agent into customer service: routine requests get answered automatically, complex cases go to the support team, and customers wait less.
AI AgentRead
10 Phantom Rooms
10 Phantom Rooms presents its virtual instruments with a premium brand site: headless CMS, Native Instruments integration and a platform built to grow.
E-CommerceReadWhat are you working on?
On the first call, you tell us where things are stuck. We'll tell you honestly whether we're the right fit. 30 minutes, free.

Jens Bohl Founder and Managing Director